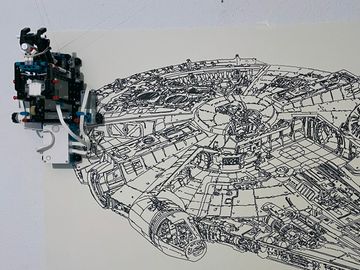
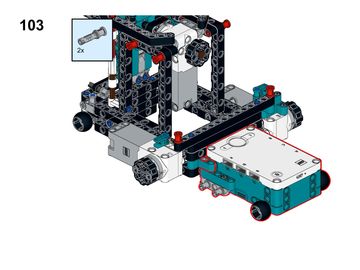
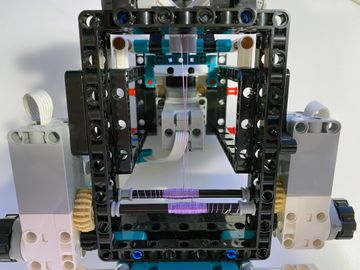
At the beginning of this year I bought the new Lego Mindstorms set. After a couple of other builds I had the idea to build a plotter which hangs from two ropes and draws on a sheet attached to the wall.
Working on this plotter was heaps of fun. There was so much room for improvements, I had plenty of ideas what I wanted to try, both in the code and on the actual build, that I am glad I never even started keeping track of the time spent.
In the end I went through 3 iterations of the plotter, optimizing the weight, moving the weight as close to the wall as possible, having the ropes close to the tip of the pen and improving the pen holder.
Also, countless tweaks of the code and test plots.
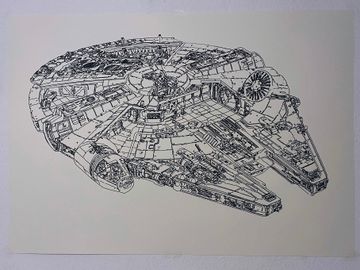
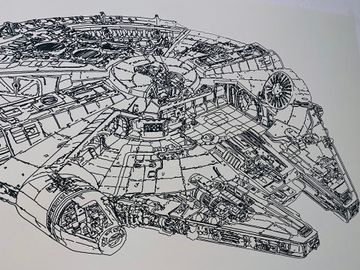
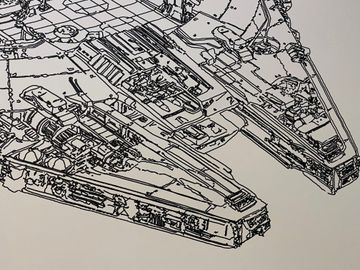
The plotter should be more or less able to plot up to any arbitrary size. The Millenium Falcon I plotted for this post is already quite big with 100x70cm in size, but that should be far away from the limit.
I decided to put together building instructions and all the code necessary to prepare images and plot them, so if you want one yourself, suit yourself.
Resources
- Building instructions (Rebrickable or Dropbox)
- Code at github
Some images and video


What you need
- Lego Mindstorms Robot Inventor 51515
- Some kind of small but strong rope with preferably minimal stretch. I used braided fishing line
- Any kind of (household) rubber band to pull the penholder down
- Any pen - Fineliner, Edding, Sharpie, Posca markers, I tried them all and all work well. I prefer pens with a wider tip, as they better hide the wiggly lines
Building
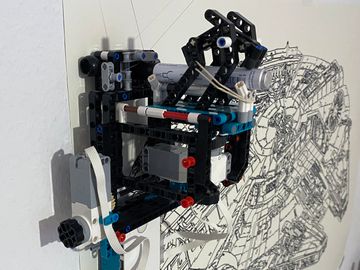
Build the plotter according to the building instructions. Once you have finished the build, you need to attach the ropes and some rubber bands to the pen holder. These steps are not included in the building instructions, as I found no way to model them there.
You can download the building instructions from Dropbox or at Rebrickable.
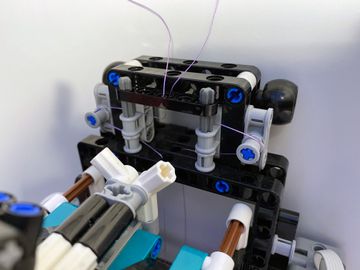
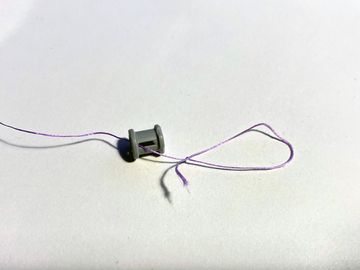
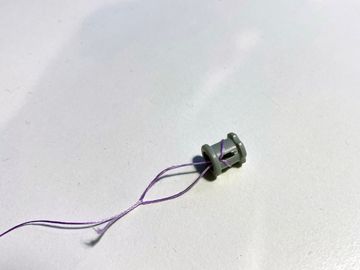
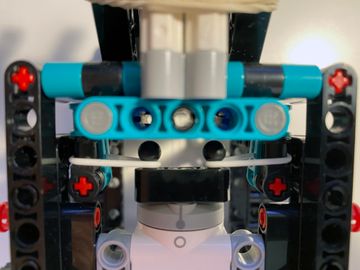
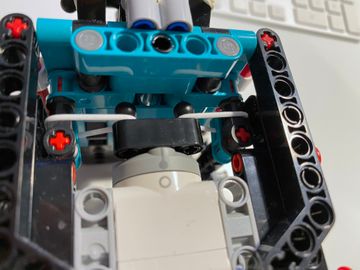
Attaching the ropes
Prepare two ropes and make knots to the ends. I used the bowline.
Fiddle the ropes through the plotter as shown on the pictures and attach to the axle.


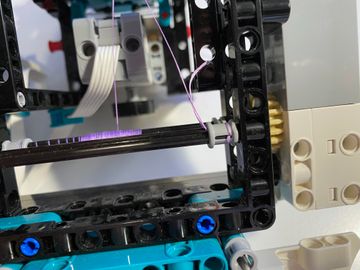

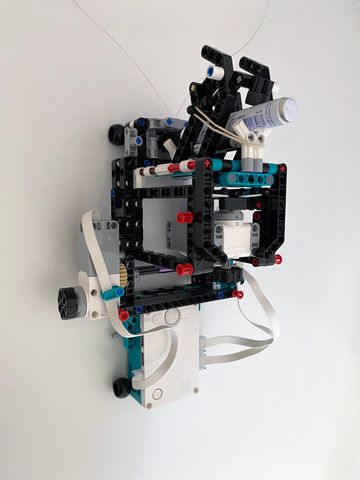
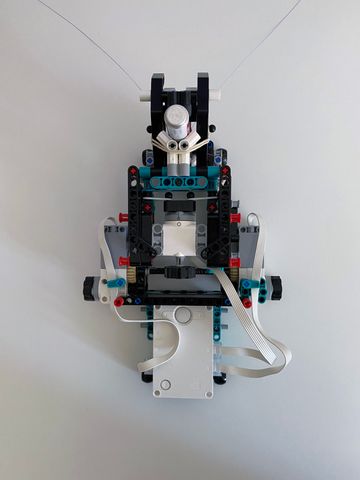
Finishing the pen-holder
The two small rubber bands from the Lego set need to be attached to the sliding mechanism. An extra rubber band needs to be attached to hold the pen holder down.


Calibration
Get the source code from github and adjust some Constants in hub/plotter.py:
- First the plotter needs to know which motor is connected to which port. Enter the correct ports for
MOTOR_LEFT,MOTOR_RIGHTandMOTOR_PEN. - If you want to print more or less accurate according to the actual size, you should measure how many mm of rope are unwounded per degree motor rotation (
MM_PER_DEGREE_LEFT,MM_PER_DEGREE_RIGHT). In my case the left motor unwounded 3760mm rope in 137816 degrees rotation. This step can be skipped, but I wouldn't recommend though. The proportions of the plot should be fine without adjustment but the actual size will be off. If you want to avoid leaving the sheet of paper and printing on the wall, you should better not skip this step.
I was to lazy to measure it a second time for the right motor, therefore I copied the value but had to swap the sign as the motor needs to rotate in the opposite direction. - Finally the plotter needs to know at what motor position the pen is down (plotting) or up (not plotting). Enter at
PEN_UPandPEN_DOWN. If your motor marks are the same as in the instructions, you don't need to change anything.
class Constants:
    # which ports are the motors connected to
    MOTOR_LEFT = hub.port.B
    MOTOR_RIGHT = hub.port.A
    MOTOR_PEN = hub.port.C

    # rope length change in mm per degree rotation of the motor
    # number should be:
    # * positive, if motor position value increases when retracting rope,
    # * negative, if motor position value increases when rope extends
    MM_PER_DEGREE_LEFT = 3760 / 137816
    MM_PER_DEGREE_RIGHT = -3760 / 137816

    # absolute motor position when drawing / not drawing
    PEN_UP = 0  # not drawing
    PEN_DOWN = 180  # drawing

    # --snip--, more constants, not necessary to change
Additionally, some parameters need to be adjusted for every plot.
Set the width and height in mm of the canvas at get_canvas_dim. These dimensions should reflect the aspect ratio of the graphic you want to plot.
If your original graphic has a ratio of 4:3, you should e.g. set it to [400, 300] to plot it as 400mm by 300mm.
Otherwise your plot's ratio will be odd as the plotter's file format does not preserve the ratio between x- and y-axis.
Measure the distance in mm between the two anchor's the rope is attached to get_anchor_distance.
Also do a sanity check afterwards. This should not be smaller than your canvas width.
Determine the position of the canvas' top left corner relative to the top left anchor (get_canvas_offset).
Either return x and y coordinates as list or use the helper function to calculate the offset from the rope lengths (usually easier):
Measure the length from the robot to the left and right anchor and enter those numbers into the method call, in my example 637mm left and 1217mm right.
class Config:
    def get_canvas_dim(self):
        """
        :return: The canvas' dimension (width, height) in mm
        This is how big the plot will be. This should also be the minimum size of
        the sheet you are printing on, if you don't want to ruin your wall
        """
        return [850, 561]

    def get_anchor_distance(self):
        """
        :return: Distance between the two rope anchors in mm.
        """
        return 1272

    def get_canvas_offset(self):
        """
        :return: Translation of the canvas coordinate system relative to the left anchor
        ELI5: How much do you go right and down from the top left anchor to
        the top left edge of your sheet
        """
        return self.calc_canvas_offset_from_rope_length(637, 1217)
Preparing a graphic / internal file format
The plotter cannot print graphic files directly, they need to be converted to a different format which is easily processable by the plotter. The format is a text file with every line containing x- and y-position of a path to draw. The positions use numbers in the range from 0-1 relative to the canvas width and height. Different paths are separated by a new line.
Following is an example which prints a cube with maximum width and height and a horizontal line through the middle with a width of half the canvas width.
0,0
1,0
1,1
0,1
0,0

0.25,0.5
0.75,0.5
I have written a script which is able to convert svgs to the plotter's format. The script can be found on github along with more instructions about optional parameters to tweak the result.
The script can be called with
# convert svg/heart.svg and write files to out/
python convert.py svg/heart.svg out/
It should be noted that only the paths' outlines are printed, fillings are ignored. Also transforms in svgs are not supported, they need to be removed before conversion. More about that also on github.
Plotting
I am using rshell to copy the code and graphic files to the plotter and start the printing process.
The process is similar to this. Connect the mindstorms hub via bluetooth or cable to your computer, then
cd path/to/wallplotter
rshell -p /dev/cu.LEGOHubA8E2C19D07F2-Ser # will be different on your machine
>
> # code only needs to be copied once, skip this next time
> mkdir /plotter
> cp hub/plotter.py /plotter/
>
> # copy graphic file
> cp svgtools/out/cube.txt /plotter/
>
> # start printing
> repl ~ execfile('/plotter/plotter.py')
> plotter.plot_file('/plotter/cube.txt')
To exit the repl press ctrl+x. To leave rshell press ctrl+d.
When transfering large files to the hub (>4mb) I experienced problems with rshell – it failed with a timeout. I had success using ampy though. Also, I recommend copying large files over usb, which already takes pretty long. See below snippet to copy using ampy.
pip install adafruit-ampy
ampy -p /dev/cu.usbmodem366E398F33381 put out/large-file.txt /plotter/large-file.txt
Test canvas size first
Before you actually start a plot, you should always make sure that the plotter stays within your sheet of paper and won't print on the wall.
For this reason I have added the file svgtools/out/cube.txt which moves the plotter along the border of the canvas. Do this first without a pen, to make sure you set the right canvas dimension.
If the plotter leaves the sheet, reduce the canvas dimensions, until the plotter stays within the paper. Only after this attach the pen to the plotter.
Nevertheless, print at your own risk. Things get wrong.
Pausing plotting
ctrl+c
> plotter.return_to_origin_after_exception()> # skip first 100 paths, start with path 101
> plotter.plot_file('/plotter/cube.txt', 100)Further improvements: self calibration
(Formulas do not render in Chrome and Opera, since they do not support MathML. Switch to Firefox or Safari to display them correctly)
I tried to add a self-calibration function. I thought it would be cool if you do not need to measure the rope lengths etc., instead the robot scans some kind of known sheet of paper with its light sensor and derives all unknowns from this.
For proper plotting, the robot needs to know its start position relative to the left anchor, the length and of the left and right rope at the start position , and the distance between the two anchors.
The sheet consists of four points with known distances between and . The robot needs to move to each point and measure the change in length of its ropes. Doing this with four points is enough to determine all unknown parameters. Though mathematically it works, it turned out to be pretty imprecise in practice (actually not too surprising). Also, it was simply a lot quicker to measure the unknowns.
Nevertheless, the trickiest part was the math. If someone wants to pick this idea up, here it is:

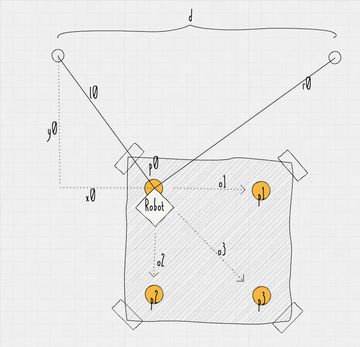
Given are the offsets between and with with and the change in rope length and from to .
We are searching for the position , the rope lengths and at and the distance between the anchors .
The lengths and at point with coordinates can be calculated as
Finding , and
First we want to determine the length of the left rope at point and the coordinates of :
We can rewrite (1) as
This can be solved for and then used to substitue in (eq. 1) to get
with the three offsets to the points we can define a system of linear equations and solve it as
Finding and
Similarly we determine and . Rewrite (2) as
and solve it again for which can be used to substitute in (eq. 2) to get
which can again be solved as system of linear equations using any two of the three offsets.